Metrics & Usage
Kontenum provides detailed metrics to help you understand traffic patterns, cache performance, and overall CDN behavior across your sites. Metrics are divided into two main pages:
- Metrics Overview and
- Metrics Details.
Metrics Overview
The Metrics Overview page gives you a high-level summary of your CDN usage for the selected month and region.
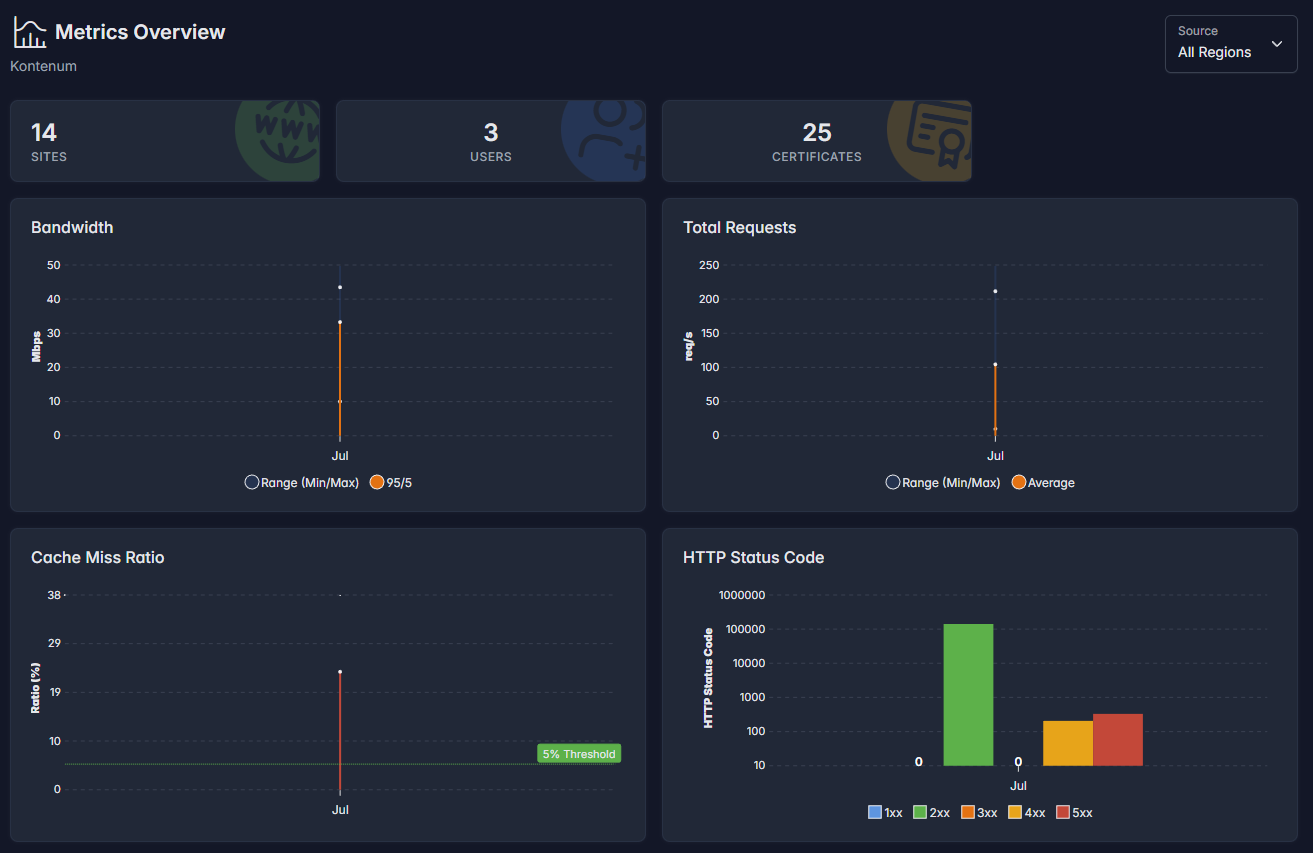
What You Can See
- Sites – Total active CDN sites in your account
- Users – Number of users under the organization
- Certificates – Total SSL certificates uploaded or issued
Monthly Summary Metrics
The overview charts summarize usage across all sites:
- Bandwidth – Aggregate traffic served by the CDN
- Total Requests – Number of HTTP requests handled
- Cache Miss Ratio – Percentage of requests forwarded to origin
- HTTP Status Code Distribution – Breakdown of response codes (1xx–5xx)
Cache Miss Ratio Threshold
A reference line at 5% cache miss ratio is shown on the chart.
- A cache miss ratio below 5% is generally considered healthy and indicates effective caching
- Higher values may indicate dynamic content, missing cache headers, or frequent purges
This threshold is provided as a guideline and may vary depending on your application behavior.
Metrics Details
The Metrics Details page provides in-depth insights for a selected month, metric type, and region.
You can switch between:
- Bandwidth
- Requests
- Cache Miss Ratio
- HTTP Status Code
Each view includes time-series charts and per-site breakdowns.
Data Freshness & Processing Delay
Metrics data is collected from all CDN edge locations and aggregated centrally.
- Near real-time data may change within the last 1 hour
- Metrics newer than 1 hour ago are considered running data and may be updated as additional edge reports are received
- Data older than 1 hour is considered finalized
This ensures accuracy across all regions while still providing timely visibility.
Bandwidth Metrics
Bandwidth metrics show how much data is delivered by the CDN over time.
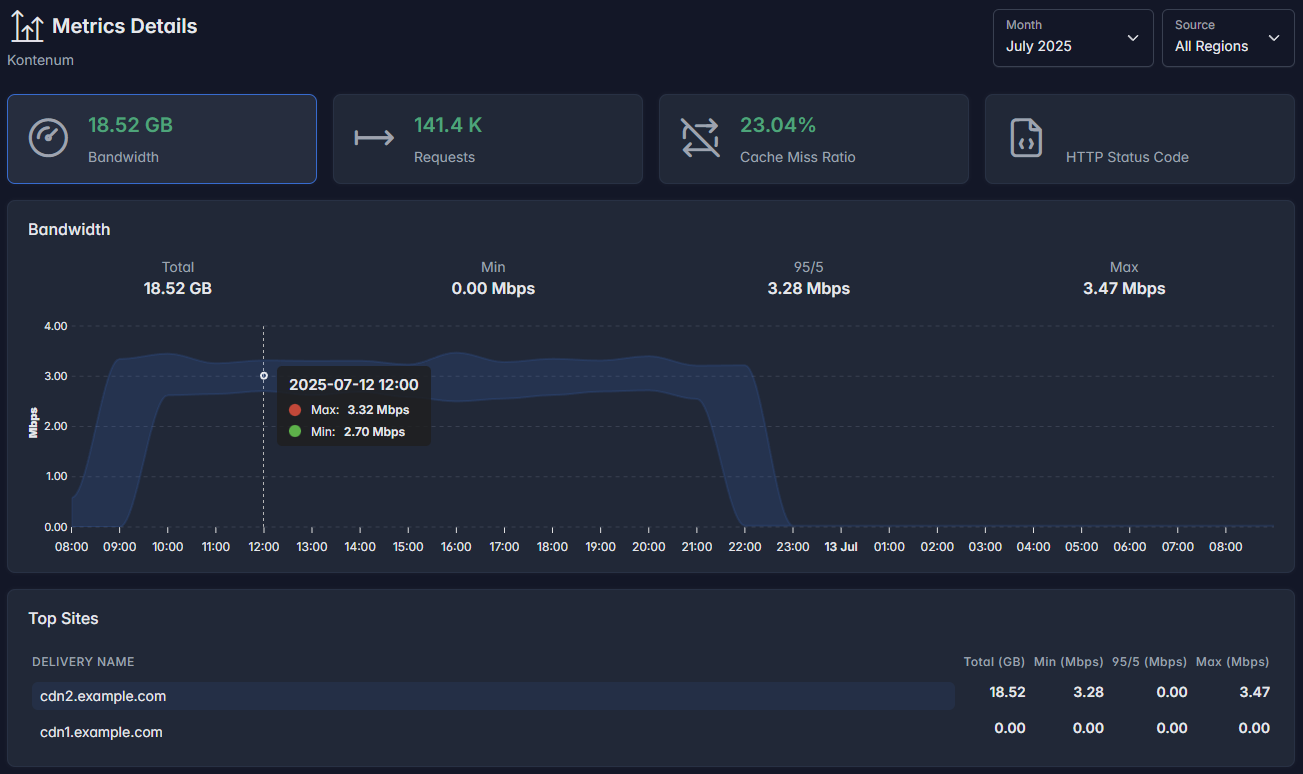
Units & Conversion
All bandwidth-related metrics use base-10 (decimal) conversion:
1 Gbps = 1000 Mbps1 Mbps = 1000 Kbps
ℹ️ This differs from Kontenum Storage metrics, which use base-2 (binary) conversion.
Available Values
- Total – Total bandwidth consumed in the selected period
- Min – Minimum observed throughput
- 95/5 – 95th percentile value (used to understand sustained traffic)
- Max – Peak bandwidth
Request Metrics
Request metrics show how many HTTP requests are handled by the CDN.
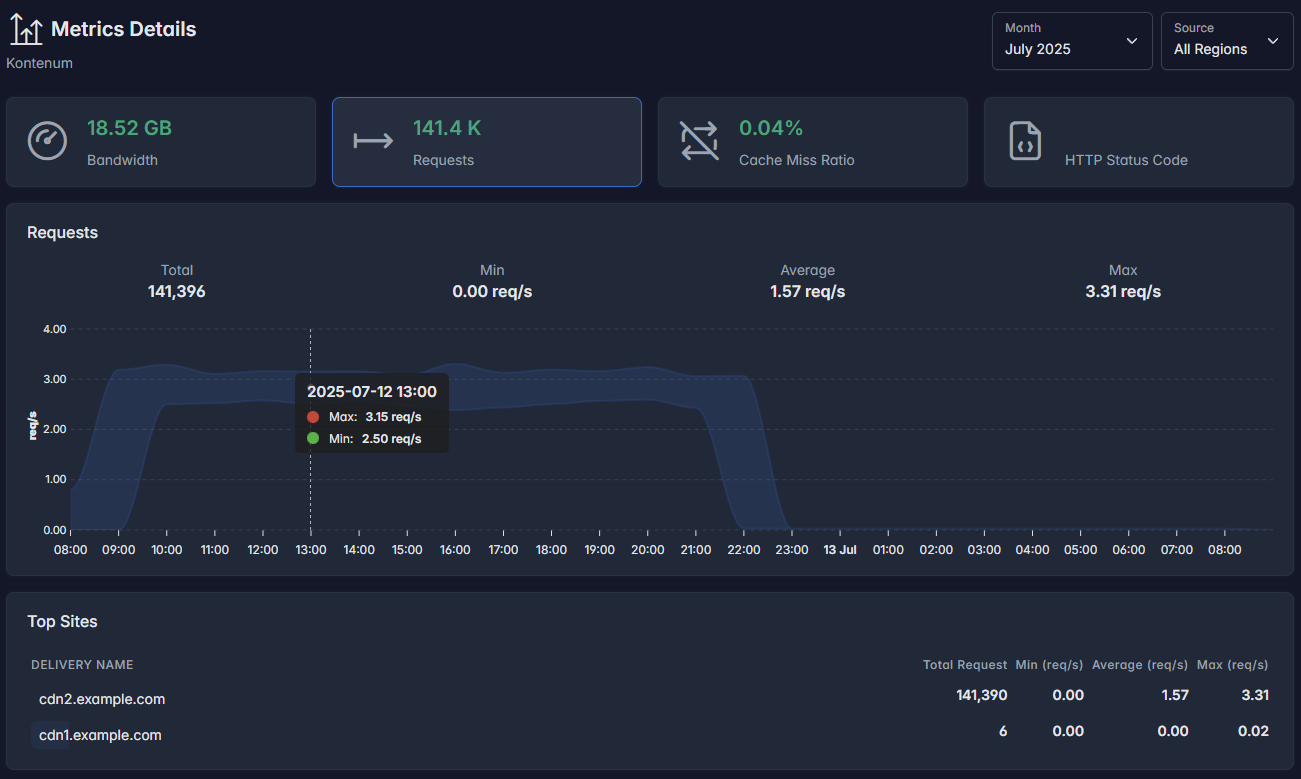
Included Statistics
- Total Requests – Total number of requests
- Min Requests/sec – Lowest observed request rate
- Average Requests/sec – Average request rate
- Max Requests/sec – Peak request rate
Top Sites
A per-site breakdown shows which delivery domains generate the most traffic.
Cache Miss Ratio
Cache Miss Ratio represents the percentage of requests that must be forwarded to the origin server.
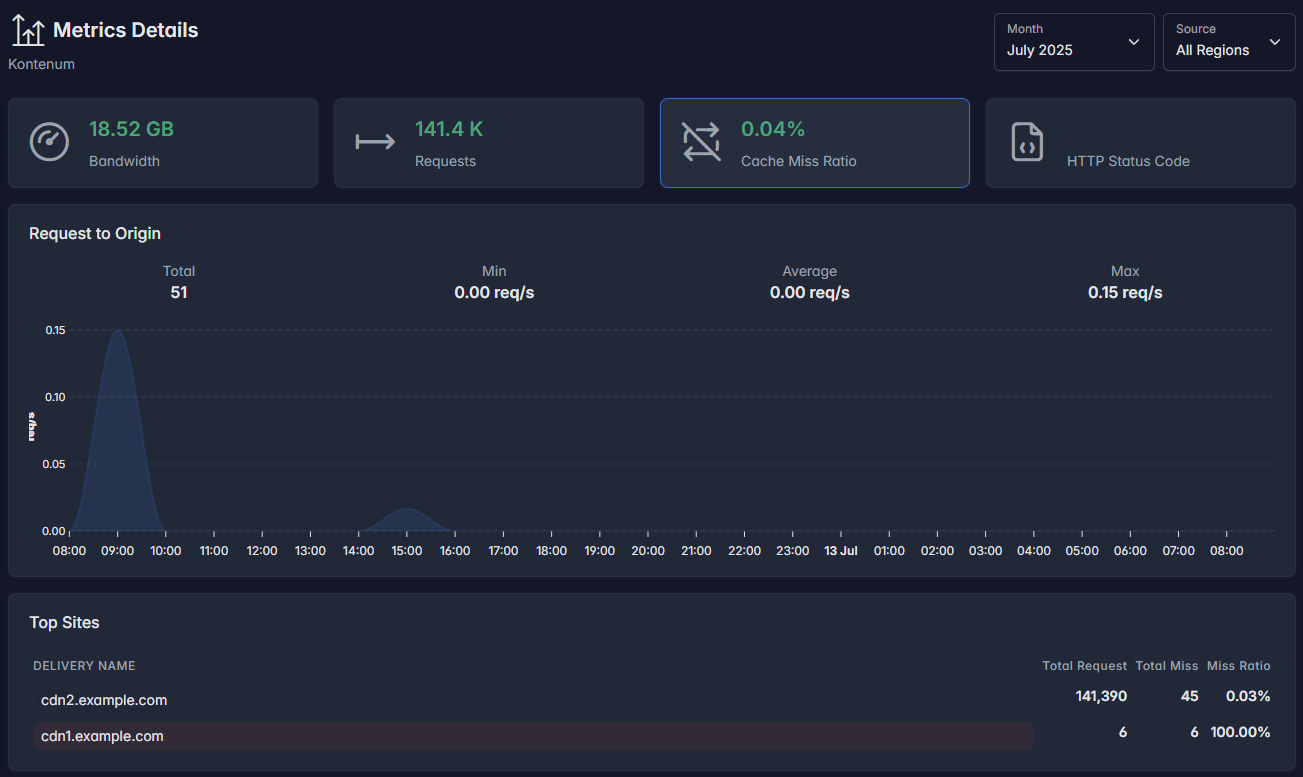
How to Interpret
- Low ratio → content is served efficiently from cache
- High ratio → frequent origin fetches
The details view also includes:
- Request to Origin graph
- Per-site miss count and miss ratio
This helps identify sites or paths that may benefit from improved caching rules.
HTTP Status Code Metrics
This view breaks down responses by HTTP status class:
- 1xx – Informational
- 2xx – Successful responses
- 3xx – Redirections
- 4xx – Client errors
- 5xx – Server errors
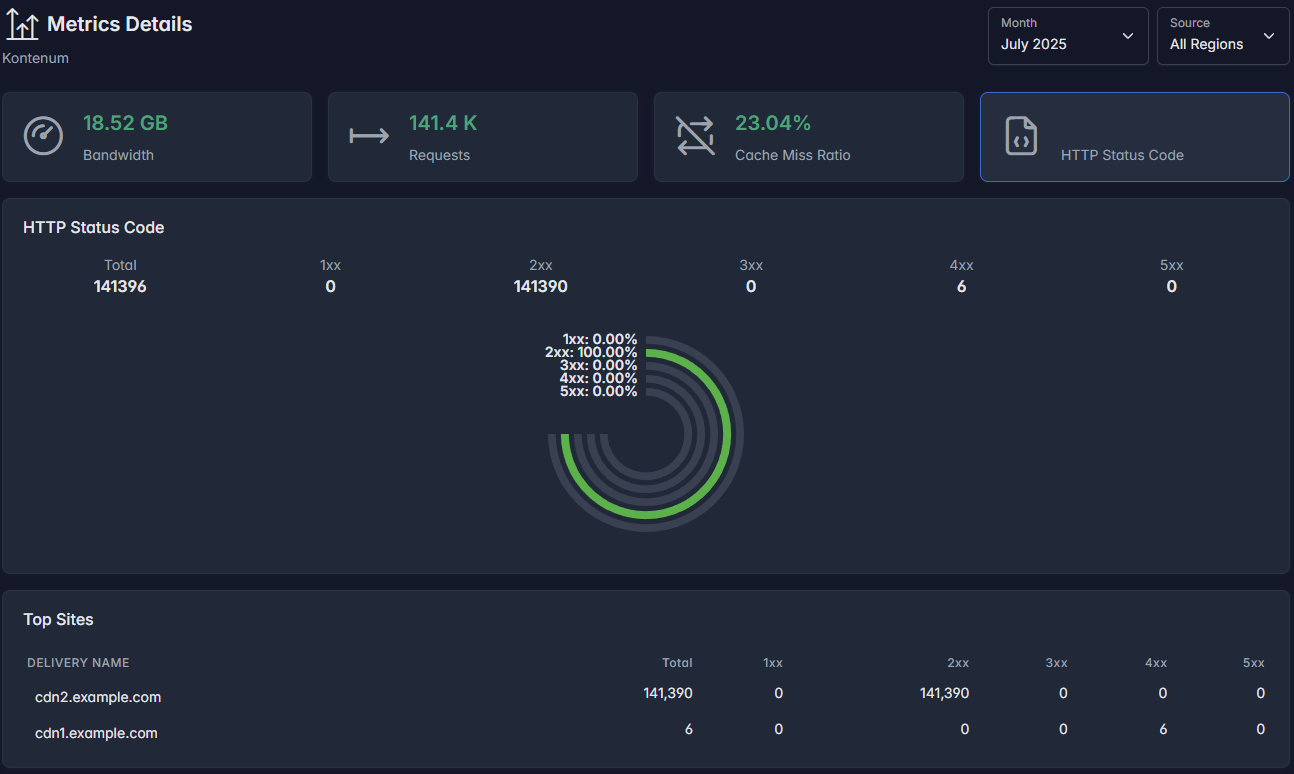
What to Look For
- A high percentage of 2xx responses indicates healthy traffic
- 4xx errors may indicate missing assets or invalid requests
- 5xx errors often point to origin issues
A per-site table shows detailed status code distribution for each delivery domain.
Best Practices
- Monitor cache miss ratio regularly and investigate sudden spikes
- Compare bandwidth and request trends to detect abnormal traffic
- Use per-site breakdowns to identify heavy or problematic domains
- Allow at least 1 hour before relying on metrics for incident analysis
If you need raw metrics data, API access, or help interpreting unusual patterns, please contact support team.